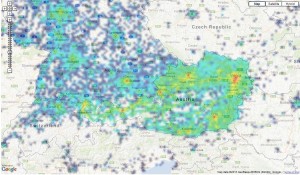
Generating Heatmap/Density Overlays for Google Maps
Quite often one wants to visualize how your customers/incidents/whatever are distributed geographically.
I’ve created a quick hack which does most of the stuff for you. The only obstacle you have to overcame is to encode all your data into long/lat format – Google Geocoder might be of some help. The coordinates have to be stored in database which allows for querying which points are within a defined long/lat box. I would recommand postgres/postgis for this task.
A real life example for Geo::Heatmap – Google Heatmaps is here
The most recent code may online casinos be found at github
Or preferably via cpan, so just have to do
cpanm Geo::Heatmap
The code still has a lot of rough corners, but if there is enough demand I’ll keep on working on it. And as everybody who sees it has some idea what he/she would like to have visualized with it, I am quite optimistic that this is going to happen. So don’t hesitate to tell me about your suggestions/bugs/fixes/etc. (admin at trust-box.at)
Have fun, but do not forget:

Posted: January 26th, 2013 under Perl.


Pingback from SQL, perl und Unix/Linux Schulungen in und um Wien » Geo::Heatmap for Google Maps
Time 6. December 2013 at 14:46
[…] of Geo::Heatmap (0.16) it should be available on the CPAN mirror of your choice Please see my older post to the same […]